 +55 (21) 3211-2223
  +1 (619) 860-6666 info@telcomanager.com
The SLAview is a complete system of monitoring of performance and failures of assets in the network. The system counts with several resources that will enable a greater knowledge of what happens in the infrastructure.
Primarily, in this article, we will highlight 3 resources of the SLAview that will go beyond the basic functionalities and maybe you don’t know.
GEOREFERENCED MAPS
One of the more utilized resources of the SLAview is the creation of groups. The main functionality of the groups is the organization of objects. Being both devices of mapped objects. The groups created will have their infrastructure reflected in maps.
The maps in SLAview originate from a hierarchical view of the groups and the objects associated to it. In this manner, the system possesses edition tools for the administrator to be able to modify the map in a way that approaches increasingly from the logical topology of its infrastructure. In addition, it is possible to visualize the alarms active for each object present in the map. Therefore, enabling a global vision of the behavior of objects that are present in the group.
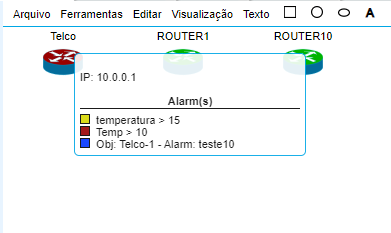
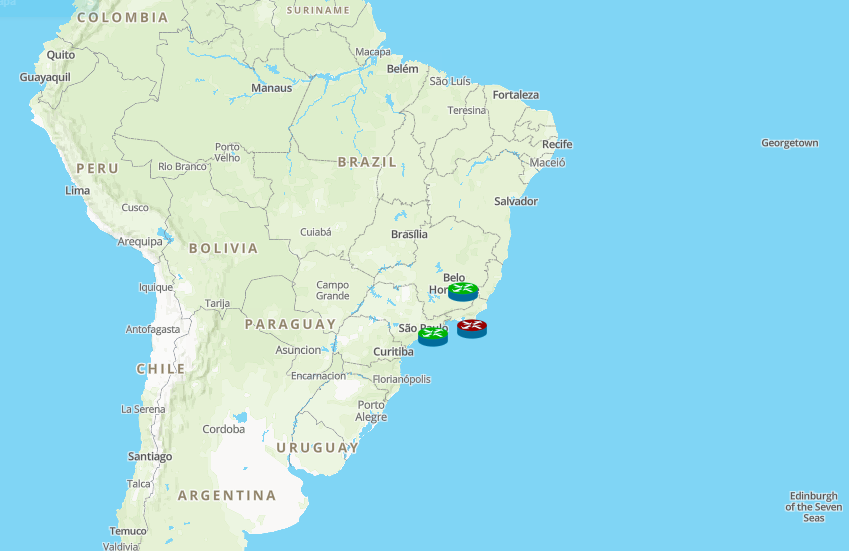
Another resource of the maps is the referenced visualization, where the objects are positioned in a geographical map with their respective latitudes and lengths. Therefore, the administrator will be capable of visualizing the real location of each monitored device.
NOC DISPLAY
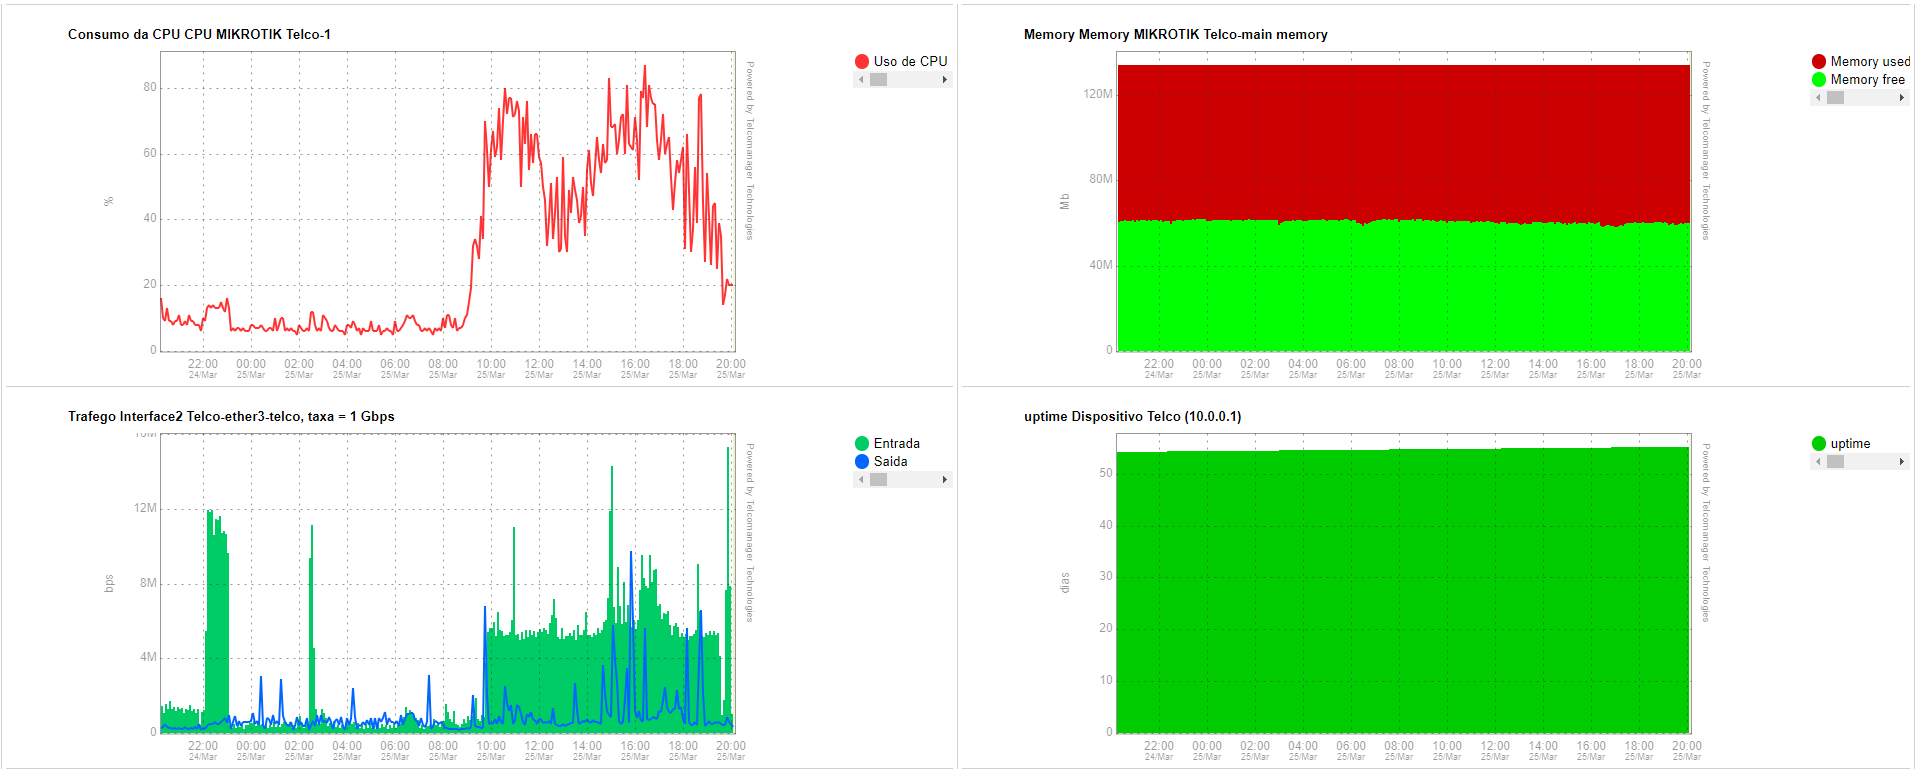
What do you think of monitoring the behavior of its assets of network in real time? With the functionality of Graph Sets, the administrator will create a screen with multiple charts. Thus, being able to opt which charts will associate to the Graph Sets with only two clicks in the mouse.
Associating the Graph Sets to the NOC Display the administrator will be capable of accompany constantly the performance of its infrastructure with automatic alternation between the sets of graphics. Accordingly, having the ability of providing data for a NOC environment.
“NOC (Network Operation Center) is also known as being a Center of Network Operations. It has as a purpose to monitor the network infrastructure from a structured place. Therefore, in this structure specific tools get united as well as specialized professionals with the objective of having a more efficient and proactive team.”
Excerpt taken from the article: https://www.telcomanager.com/blog/a-sua-empresa-ja-possui-um-noc/
DASHBOARD
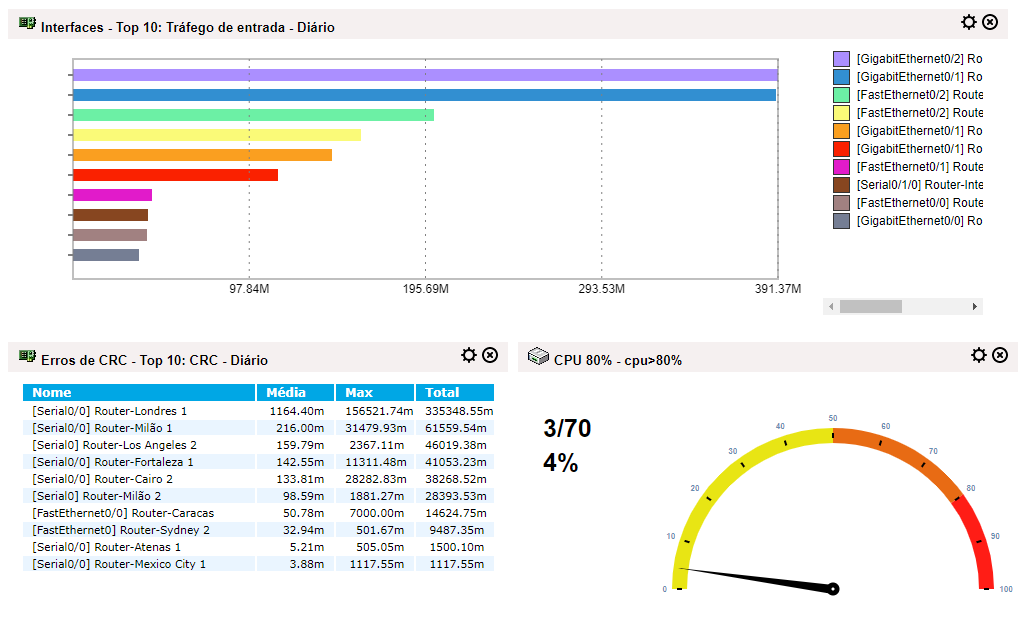
The dashboard is one area completely personalized where the administrator will be able to visualize several indicators of performance of its infrastructure through widgets. The widgets will be able to be configured for demonstrating data in the form of a pizza chart, bar graphs, reports or gauge.
The widget of the gauge type (CPU 80%) demonstrated in the image below is utilized for the monitoring of alarms, showing the amount of alarmed objects and the amount of objects associated to the alarm. Thus, optimizing the identification of flows in the infrastructure of networks through a friendly interface and completely customizable.
FINAL CONSIDERATIONS
The SLAview is a management and monitoring system of network capable of evaluating its behavior and detecting failures in an easier and practical way.
In this way, there are no doubts about the importance of investing on network management. Therefore, bringing not only benefits to the visibility of the network but also being a way to guarantee an agile and proactive IT Team.
Thinking of that, Telcomanager present in the market since 2002, and a leading Latin America brand in the sector of software for managing networks. Also counting with a unique and innovative technology, deploying smart solutions in the monitoring of data that will provide a stratified vision of the traffic, is now allowing your Company to follow the most important aspects of your network, in real time.