 +55 (21) 3211-2223 info@telcomanager.com
Introduction
One of the most difficult tasks for the network administrator is network planning and capacity management. IT Capacity Planning is a process that involves a serie of dimensioning over intercorrelated areas to ensure the company have enough IT resources to run the business. This includes from network resources, such as links and routers, to equipments and software, like desktops and licenses. Also it has to take in count the number of people that support the IT operation on a daily basis. A poorly IT dimensioned company can bring a significant loss of revenue for the business, causing more financial damage than investing in the proper Capacity Planning. One might say that the goal of Capacity Planning is to reduce the discrepancy between the actual demand and the actual offered by the IT resources.
This article shows how you use Network Traffic Characterization tools to reduce the gap between IT resources and the actual IT demand, in addition how you can use to create trends and plan ahead your expenses and IT investments.
Performing the Capacity Planning
The first step is to obtain the IT infrastructure demand targets to be met in the next financial year, especially in areas like marketing, product and sales. From the perspective of the current IT demands, these targets can either be increased or reduced, depending on the strategy of the company.
The second step is a survey to identify the network bandwidth requirements for each application.
With the application bandwidth requirements it is possible to quantify the total bandwidth required based on the usage of each department. However, is important not to generalize and make an estimate of bandwidth per user without classifying each application. The reason is because each department of the company uses different applications along the day, take the network bandwidth account only per user creates an error that could lead to an under or over network dimensioning. In fact, this is the key point of the capacity planning: segregate users by applications then dimension the network links, taking into account the redundancy requirements and SLAs.
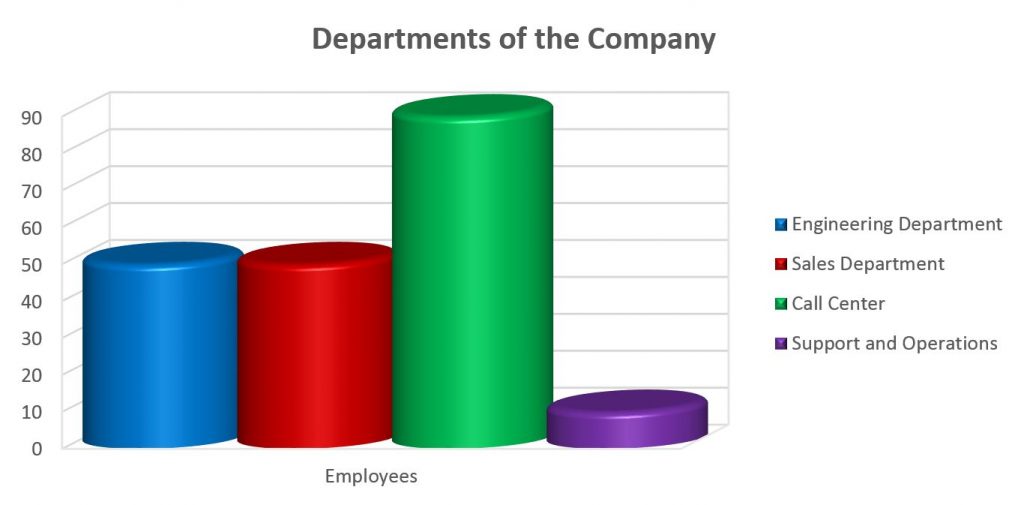
To clarify the concept discussed above, suppose a company has a branch with 200 employees allocated in Fort Collins (CO), with a total of 40 Mbps network capacity to interconnect to the headquarters in Denver (CO). At the present moment the company has the following staff distribution in Fort Collins:
- 50 employees in Engineering Department;
- 50 employees in Sales Department;
- 90 employees leased in Call Center;
- 10 leased employees in Support and Operations;
The company decided to expand its operation and is intended to hire 100 additional employees to work in the Support and Operations department, and will allocate all of them in Fort Collins.
Question: How much network bandwidth the company will have to buy to accommodate the new staff? And just to add more complication, the new contract has a discount if is signed for 24 months. How to dimension correctly the bandwidth to maximize the investment?
So if one decides to estimate the new usage based on the traffic history, will possibly collect the WAN link utilization data history for the last few month or so. This approach is not accurate, because it doesn’t give details on the usage per application or even per department.
Back to our example, imagine the network links have been used in the past 6 months with an average per day (8am to 5pm) of 60%, with peaks of 80% near COB (Close of Business). Normally, the IT engineers use a simplistic method to calculate the new link, in this example it would be as follow:
- – Peak usage at COB= 80% of 40Mbps = 32Mbps
- – Average usage (8am to 5pm)= 60% of 40Mbps = 24Mbps
- – Peak traffic per user at COB = 32/200 = 160kbps
- – Average traffic per user (8am to 5pm) = 24/200 = 120kbps
- – New Peak traffic = 300 * 160kbps = 48000 = 48Mbps
- – New Link Capacity based on Peak = 48Mbps (80% of the link) = 48/80% = 60Mbps
- – New Average traffic = 300 * 120kbps = 36000 = 36Mbps
- – New Link Capacity based on Average = 36Mbps (40% of the link) = 36/40% = 60Mbps
With these calculations, the IT engineers would have determined that the new link capacity needs to be 60Mbps. But after deploying the new network links and hiring the new 100 employes, the traffic during peak hour still 32Mbps, and the average traffic usage only grows from 24Mbps to 25Mbps.
The new contract with the service provider added an amount of 6,000.00 USD per month including 6,000 USD for setup and configuration. Therefore, the 24 months contract has added to OPEX a total of 150,000.00 USD.
The first dimensioning method was inaccurate and added an unnecessary OPEX of 150K USD.
So let’s dig the problem and see what went wrong with the calculations. Using TRAFip to monitor the network for the last 6 months, it showed the following utilization for Peak at COB and Average usage between 8am to 5pm:
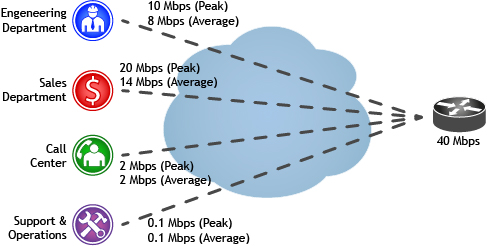
- Peak usage at COB= 80% of 40Mbps = 32Mbps, with the following distribution:
- 20Mbps from Sales Department
- 10Mbps from Engineering Department
- 2Mbps from Call Centre
- 0.1 Mbps from Support and Operations
- Average usage (8am to 5pm):
- 14Mbps from Sales Department
- 8Mbps from Engineering Department
- 2Mbps from Call Centre
- 0.1Mbps from Support and Operations
With TRAFip it would be easy to separate the traffic per department and understand what is the behaviour of each area of the company. For example:
- Sales Department is the major user, and did not add 6Mbps extra during peak hour, manly with because of the reports that has to be generated and emails sent.
- Engineering Department uses in average 8Mbps, and add only 2Mbps during peak hour. The main usage for Engineering is to update the engineering documents and provide input for the Sales Department. 90% of the 2Mbps added during Peak hour goes from Engineering to Sales database.
- Call centre does not change in terms of traffic, it is fixed on 2Mbps even during peak hours.
- Support and Operations does not use the network at all, mainly because their access is directly to the devices, and they use terminal services which use very low bandwidth.
As we can see with TRAFip is possible to illustrate in the details ot the traffic of each department. And as a conclusion it is possible to see that Support and Operations does not use the network much, using only 0.1Mbps at average during the day and nothing during COB. The average usage per Support and Operations employee is 0.01Mbps or 10kbps.
Back to our calculations, if we used TRAFip to calculate, we would forecast the amount of traffic for the new 100 employees as only 100×0.01Mbps = 1Mbps for the average traffic during the day.
150,000 USD could be save on network OPEX if TRAFip was used to characterize the Company network traffic.
Conclusion
Network Capacity Planning is focus on making the best usage of your investment without degrading your services. And for that, it requires appropriate tools to forecast the correct network demand. Some companies still avoid to invest in essential tools to analyse their networks, paying higher costs when deploying unnecessary over-dimensioning of their infrastructure.
Using TRAFip, Capacity Planning is based on detail usage data, not bad estimates or intuition. With confidence, the decisions can be made faster to justify augmentations or cuts.
More about TRAFip?
TRAFip is a easy and affordable solution which provide the appropriate tools to perform the most effective Capacity Planning decisions.
TRAFip adds significant value over other network management areas like assurance, reporting and fault localization. It is a tool that allows the network administrator to collect the information passing over the network and show via reports, graphs and tables. With TRAFip network administrators can have a reliable tool that provides a complete overview of the traffic flows, applications, devices and interfaces.