 +55 (21) 3211-2223 info@telcomanager.com
Analyzing your traffic trends
Data networks have a continuous rise of traffic demand that obligates the networks to expand frequently. In large networks this constant demand for expansion is even higher. In some cases, this expansion can be translated in a mathematical formula, from which you can generate an evolution curve over time. This curve will give you important data that you can analyze, allowing you to extrapolate the behavior and expansion needs of your network in a specific point in the future. This exercise is called trend analysis.
Our Telcomanager Trend Analysis module was developed in order to help Network Administrators to act proactively in the network, enabling you to plan your network capacity and needed expansion in a much more accurate way, which allows you to plan your hardware purchases in the most efficient manner and ensure that you are spending the money you really need to ensure the ideal network behavior.
With its network data collection and analysis capability the Telcomanager analysis tools can predict all sorts of practical information to the Administrator, such as the traffic in a network point for a given date or when a link will need an update, to name a few.
For example, when the Administrator configures a custom graphic for a certain parameter in SLAview, the Trend Analysis module for that graphic can be activated making the system able to predict the behavior of that parameter. The trend analysis module can also be used to calculate when a user defined threshold will be violated or which value a certain parameter has at any given date. With the Trend Analysis module you can have a clear view of how your network will perform in the future!

When activating the Trend Analysis module, the Administrator can choose to use standard configurations or custom configuration. If you choose the custom configuration you can define the degree of the polynomial used in the analysis (currently just linear available), the sample rate (days, weeks or months) and the number of samples used to calculate the trend. For example in Figure 1 the analysis is done every 2 days.
P.S. Trend reports will only be available one day after activation and configuration since the trend analysis is run on a daily basis.
Graphic Reports
After activating and configuring a Trend Analysis in any given graphic the Network Administrator can do a Projection Violation. In order to do this, right click in the graphic, select Projection Violation and input the maximum value. The SLAview will then show you the projection, based on the trend analysis, of when this value will be violated.

Besides the information provided in the Projection window the SLAview will display a trend graphic with the threshold line in it.

Table view reports
Apart from the graphic reports SLAview enables you to have table view reports. This will allow you to have multiple trend analysis curves in one report. In order to do this, access the SLAview projection item under the Reports tab. Here you can create a new report or you can save a report as a template which enables you to schedule an automatic creation of it.

When the Save Template option is selected a series of advanced settings are added to your window. On those the Network Administrator can define several parameters such as the period of the report creation and the user access rights, among others. This way, this task can be easily automated, removing a monotonous and repetitive overhead!
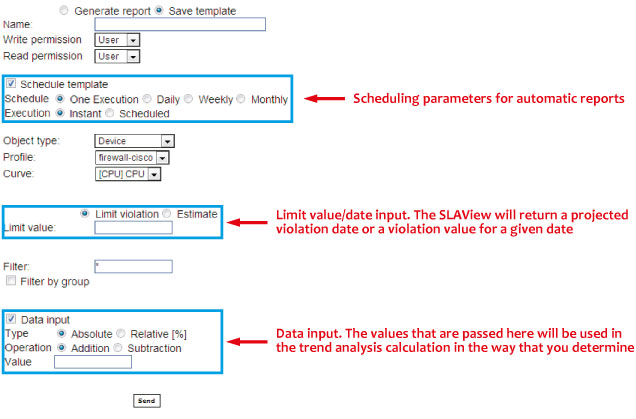
In a template, the Network Administrator can also provide a violation threshold value that will be used by SLAview to extrapolate a date for the violation or alternatively provide a violation date that will extrapolate the threshold value. This feature also allows you to add data at any given time to your new report. Just check the Data Input box and you can make real time changes in your trend analysis calculation.
Conclusion
With the trend analysis module you can now have a deep knowledge of your network. This enables you to know such things as when it is time to buy new hardware, where your network bottlenecks are, and to which network elements you can route your traffic in order to balance the network. This way you can have a network using the available resources in an ideal way, stopping you from spending money on unnecessary hardware!
With our tools you can focus on your network expansion, or on selecting new business partners or new technologies, all while having the peace of mind that our tools are doing the monotonous and repetitive calculus and projections that you need to get the best from your network.