 +55 (21) 3211-2223 info@telcomanager.com
You probably heard the following sentence: “The network is slow”. But what could be the reason to experience a “slow network”? This question is difficult to answer straight away.
Even knowing few network indicators, the question might not be answered. Specially with the interference of some factors such as asynchronous path with congestion. Simple tests like “ping” or “traceroute” might not be enough.
In order to understand the “slowness” of the network, you will need to know a few indicators, such as:
- One way Package Loss
- One way Latency
- One way Jitter
- Package Duplication
- Package Out Of Order
- Utilization
Those indicators when measured between two elements of the network will provide important information about the performance of the infrastructure. Such information might represent the key to answer the question.
How could you gain access to those indicators?
TWAMP
TWAMP (Two-Way Active Measurement Protocol) is an open protocol defined by RFC 5357, its architecture is based on the OWAMP (One-Way Active Measurement Protocol – RFC 4656), nevertheless it is different from the OWAMP, and the TWAMP will provide the ability to carry out measurements of paths back and forth. With it, the TWAMP protocol is used on the monitoring of the both directions in IP networks. Therefore, enabling the estimation of performance indicators about the network, such as those mentioned in the topic above.
The TWAMP will allow the measurement of the performance between two endpoints (since both support the protocol). Due to its flexible architecture, it will be able to accomplish the measurement independently of the type or supplier of the device.
The operation of the TWAMP might be divided into four sections. Two of them by the side of the client and the other two on the side of the server.
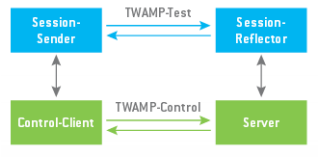
- Twamp Client
- Control-Client – Initiates the TCP connection with the Server on the TWAMP standard door, initiating an exchange of messages with regards to the integrity and security.
- Session-Sender – After the session is initiated between the client and the server, packages attached to the tests are sent to the Session-Reflector.
- Twamp Server
- Server – Respond to the messages coming from the Control-Client until the acceptance and the conclusion of the handshake.
- Session-Reflector – Based on the packages coming from the tests received, it sends back the measurement packages.
When the client receives the measurement packages back, it will be capable of determining the indicators referring to both routes (outward and backwards).
ADVANTAGES OF THE TWAMP
The test packages exchanged between the Session-Sender and the Session-Reflector include fields of timestamp. At the same time, the Twamp will be capable of measuring precisely the time of entry and exit. Also, it will be able to ignore the think time. Thus, avoiding the interference in the measurement of the indicators such as the jitter and the latency. Mainly because it is about situations where a distortion of milliseconds can make the difference.
With the TWAMP, it will be possible to configure test packages in order for them to behave as if they are packages of a random application. In the face of such scenario, the tests will be closer to the real behavior. Therefore, ensuring more reliability on the measures carried out. Differently from the ICMP (ping) which in many situations, can be benefited by possessing (inside the pattern settings) higher priority than certain applications.
Finally, as mentioned, the TWAMP is a multi-vendor protocol. In other words, the brand and the model of the devices won’t matter. Since there is compatibility with the protocol, it will be possible to carry out the tests and obtain reliable and precise statistics about the infrastructure.
In order to enjoy the functionalities of this protocol, the usage of a system that actually monitors the performance is recommended. The SLAview will be capable of interpret the indicators supplied by the protocol TWAMP and, with it, can provide valuable charts and reports making your infrastructure even more resilient.
FINAL CONSIDERATIONS
The SLAview is a management and monitoring system of networks capable of assessing performances and detecting failures in an easy and practical way.
With such advantages, there could no doubt about the importance of investing in the management of your network. Consequently, bringing out not only benefits related to the visibility of the network, but also becoming a way to guarantee that your IT team get dynamic and proactive.
Thinking of all those advantages, the Telcomanager with more than 17 years of experience in the market. A leader in Latin America on the sector of software for managing networks, with a unique and innovative methodology. Also making available intelligent solutions for the monitoring of data that will provide stratified views of your actual traffic. It will allow your company to keep the right track of key aspects of a network in real time.