 +55 (21) 3211-2223 info@telcomanager.com
In the current operating environment of companies, the IT department and its ramifications are no longer simply a dispensable area. As such, it is an essential sector both in economic aspects and in its functional structures. Thus, it becomes increasingly necessary to keep the network infrastructure functional, resilient, scalable and, above all, with an adequate capacity for the demand.
However, keeping up with the status and compliance of these factors can be a difficult task, especially if good capacity planning is not being done. The network must be monitored in all its functional management areas. Even in this scenario, some key performance indicators may not be accounted for in the system analysis.
In this sense, we will seek in this article to understand in general how performance management is important. As well as realizing the importance of defining and monitoring performance indicators and how this data can be demonstrated.
THE IMPORTANCE OF KPIs IN THE PERFORMANCE MANAGEMENT SCENARIO
Key performance indicators (KPIs) are items generally used by companies to monitor the effectiveness of sectors or procedures. In the context of observability of computer networks, KPIs are essential items that can point out metrics on the behavior of network assets, and not only the on current behavior, but also on a performance history.
Thus, enabling the projection of future performance, helping to raise the level of corporate governance with the allocation of technical resources and generating a trend of data-based management. In addition, these parameters can be used to verify compliance with pre-established service-level agreements (SLA) between the customer and the supplier.
The main indicators will be chosen based on the company’s infrastructure and business needs, so not all companies will use the same parameters to measure the performance of their IT environment.
Before selecting them, it is important to carry out good capacity planning, as performance problems are directly related to the overall capacity of the infrastructure. In this scenario, ensuring compliance with the SLA compliance, identifying critical factors for the proper functioning of the technology park, and collecting data through a monitoring system will be critical allies.
Therefore, we can now highlight some of the most used indicators as key parameters for measuring performance metrics.
AVAILABILITY
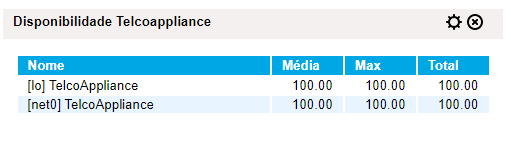
Availability is one of the most elementary items in terms of performance. Considering this, we can associate, for example, the availability of a network asset in its entirety or even assess the availability of a network interface, or a Link.
Typically, this metric is associated with a response (or lack thereof) using the ICMP protocol. This KPI can also be measured with an operational downtime of an interface. An uptime of less than 95% can be considered critical. The image below shows an SLAview dashboard component of link availability:
LATENCY AND JITTER
These indicators must be analyzed together and are also essential. We can understand latency as the delay in response time to a given request, usually given in milliseconds. Jitter, on the other hand, can be understood as the variation of latencies, in networks that use latency-sensitive applications, jitter cannot be too high.
CPU CONSUMPTION
This is very relevant, mainly to ensure fluidity in network processes. Ideally, network managers will receive alerts based on the high percentage CPU consumption of network assets. They should also be able to list the devices that have the highest CPU consumption.
BANDWIDTH USAGE
The observability of this parameter is important precisely to evaluate a metric in absolute terms or even as percentages of link usage.
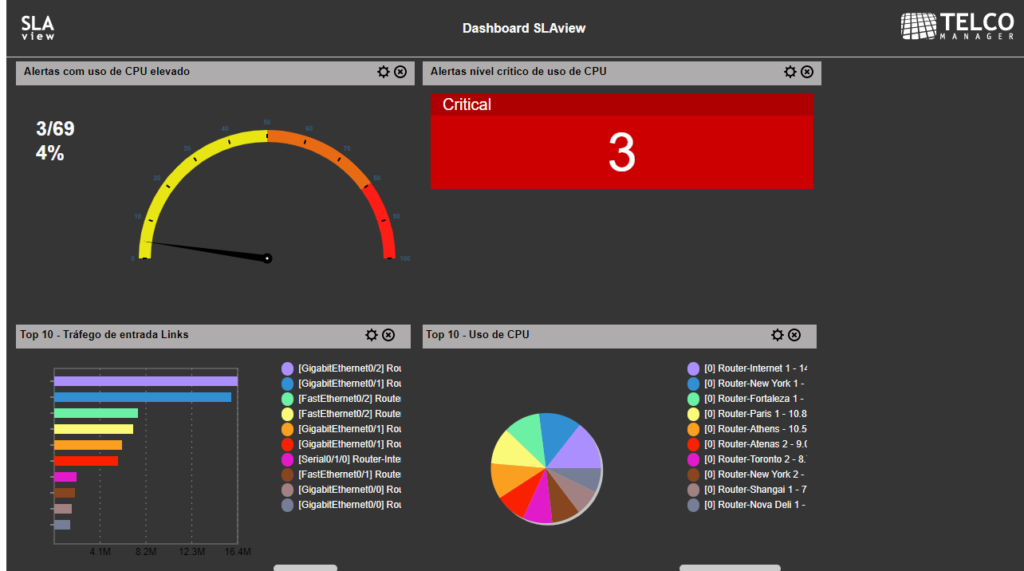
There are other indicators that we can mention, such as network congestion rates, noise, or CRC errors, among others. The most interesting of all this is that there is the possibility to visualize all these KPIs in a dashboard that can be dynamically updated. In this sense, SLAview is an ideal tool for this visualization and analysis. The image below shows an SLAview dashboard with some KPIs and alerts related to them:
FINAL CONSIDERATIONS
SLAview is a simple-to-use and cost-effective tool. It performs fault and performance management in an assertive way. With SLAview, you can create KPIs, dashboards, and several other analyses related to the performance management of your network assets.
Therefore, there is no doubt about the importance of investing in network management. The good practices demonstrated here bring not only operational benefits, but also contribute to proactive IT, ensure the possibility of allocating IT resources, and all of this has a huge positive impact on your network governance.
With this in mind, Telcomanager, Latin America’s leader in the network management software sector, on the market since 2002 with a unique and innovative methodology, provides intelligent solutions for data monitoring. Their solutions can provide complete visibility to the customer’s infrastructure, allowing companies to keep track of the main aspects of their network.
Posted on 03/18/2022